#Logarithm vs natural logarithm
Explore tagged Tumblr posts
Visit Tumblr Blog
Explore Tumblr blogs with no restrictions, modern design and the best experience.
Last Seen Tumblr Blogs


Fun Fact
BuzzFeed published a report claiming that Tumblr was utilized as a distribution channel for Russian agents to influence American voting habits during the 2016 presidential election in Feb 2018.
Text
Physics "Friday" #9 [OPINION]: Is Fahrenheit the better temperature scale?
So as the title suggests, this post is a lot less facts and logic, and a lot more opinionated. It is still physics-y I just believe it's an interesting way to delve into a subject by turning it into an opinionated peice.
Preamble: A summary of Metric vs. Imperial arguments
Education level: Primary (Y3/4)
Topic: Measuring Systems (Metrology)
Now before you throw your hands up at the title and your silly little internet brain is like "this silly impericuck is fahrenpilled!" ... I'm an astronomy student living in Australia - I use SI units (and other unit systems) on the daily.
Though ... it is pretty notorious in astronomy to use like 17 different unit systems. Here's a list of examples:
My beloved SI units
CGS Units
Whatever the fuck a Jansky is
Don't even start with natural units I can't live without big G
"Ampere in CGS units is g1/2 cm3/2 s−2"
Solar Luminosity/Mass of Sun
Angstroms (like please can we just use nanometers?)
How many Jupiters or Earths fit into this cloud of gas?
The vomit of parallax units i.e. AU, pc, Mpc, arcseconds, radians
Steradians (Solid angles can be finicky)
Logarithms, logarithms everywhere!
Hubble's constant being in km/s/Mpc but then having to turn that into Hz or per year - like can someone please acknowledged how cursed this is?
When you do Kepler's 3rd law on Mercury and realise it doesn't work (because you forgot Einstein existed) ... so no units end up working
ADUs and/or whatever you get when you deal with telescope outputs
And as an Australian, I use SI units very regularly. Only measurements of human height and cooking weights are really imperial. And I can express all of them in metric units.
Now generally, the Metric (or SI) units are better than the imperial (or USC) units. The main points in favour of SI are:
(Almost) Everybody uses it
It's basically universal in science (see exceptions above)
It fits well with our base 10 counting system, easy scaling (e.g. 1 kg = 1 000 g = 1 000 000 mg)
It's directly pinned to many natural constants and unchanging laws
Different units interact with eachother much better
Now, generally, the main arguments for imperial units involve a bunch of patriots™ screaming about how "THIS IS THE CoUNTRY OF FREEDOM AND GOD!! AND I AIN'T USING NO CHINESE UNITS!!!1!".
That, or how metrification is hard. Which, well, metrification can occur over the course of decades, literally teaching your kids metric helps the country adjust to a metric system.
The best arguments I've found for imperial units is as follows:
Numbers like 6, 12, 60 etc. - i.e. units based on highly composite numbers - are very easily divisible by 2, 3, and 4
Units like feet, inches, pounds, stone, etc. are of a much more human-friendly scale. Because these units are based on bodily proportions or common objects
Generally, the arguments for metric vastly outweigh the arguments for imperial. And the main reason why is that the two arguments for imperial conflict with eachother. You cannot easily subdivide your units neatly and have human units.
For example, the Roman mile is a unit that measures the usual amount of distance a footsoldier can cover before needing a short stop. An acre is the amount of land that a manual-labour farmer can cover in a day's work. An inch is about the size of your thumb.
The problem is that all three of these units, based on length, are completely off kilter. 1 acre = 43,650 square feet, 1 Roman mile = 58260 in, etc.
The only cases where I would say the human-ness and divisibility of units actually becomes a stronger argument than decimalised units are, time and temperature.
Time is obvious. 1 hour = 60 minutes = 3600 seconds. It's nice, clean and simple. And an hour or half-hour is a very human unit, the same as a second or a minute. We often operate on hour and minute schedules, and that's not just because of capitalism. 30 minutes just appears to be the amount of time we like to work before taking a short rest.
Temperature is a bit more nebulous however ...
Where (I think) Celsius fails
Of course, celsius is an understandable scale. 0 C = Water Freezes, 100 C = water boils. Pinning your scale on water makes life easy for you as you know what the bounds are.
The problem is that there are temperatures that exist outside of the 0-100 scale. And this kinda breaks the neat decimalisation of a scale.
A cold winter's day in Tasmania could drop into the negatives. And just because your in the negatives doesn't mean ocean water or rain will freeze. Temperatures below 0 C doesn't guarantee snowfall.
Similarly, say you are in a desert during the day. The temperature can get as high as 50 C - it's reasonable to say that you're unlikely to see temperatures above 50 C outside of your oven or kettle.
Do you normally see temperatures between 70 - 90 C? Unless if you're pasteurising milk, distilling alcohol, or doing chemistry, you are not going to encounter these temperatures. And do you really need your temperature numbers to be below 100 to do chemistry?
This is the downside of Celsius. Because temperature is a scale, and operates differently to other units, it doesn't really matter where you set the zero point. A boiling point of ethanol at "78" is no better than one at "173".
Celsius also doesn't account for temperatures that are very well below the freezing point of water, temperatures which are very common to experience.
So is Fahrenheit Better?
Fahrenheit solves this problem, partially. It's a more human friendly scale. 0 F is a very very cold day whereas 100 F is a very very hot day. Things beyond both numbers are relegated to the scientists, chefs, and extremophiles of the world.
If we were to completely remove all requirements of not pissing off a bunch of people, we could even create our own temperature scale to make things even better: 0 X = -50 C and 100 X = 50 C.
Even better because now the 0 and 100 of this scale becomes the absolute limit of what we could normally experience on earth, the hottest desert and the coldest tundra. It even comes with the benefit that 50 X = the freezing point of water and 150 X = the boiling point of water - it preserves our common "anchors" of the phases of water.
The problem is that there's a second hidden benefit of Fahrenheit: it's specificity. What do I mean by that?
Well, for every 1 C increase in temperature, the Fahrenheit scale increases by 1.8 F. This means that a temperature of 20 C could mean 68 F or 69 F.
For a lot of normal/casual processes, the Celsius scale may require us get past the decimal point, to express minor changes in temperature, whereas Fahrenheit would not.
For chemistry and physics, our significant figure requirements immediately become extra precise. 58.8 F is a more accurate measurement than 14.9 C, without requiring any more decimal places.
You may say "well why not we use a deci-Celsius scale where 1000 dC = boiling point of water". The issue is that too much precision may be putting it over the top. We don't measure the size of cities in centimetres.
But then what about Kelvin
Of course, the main SI unit for temperature, and the unit physicists and chemists use is the Kelvin. The reason for this is of course:
It is tied to absolute zero by setting it to 0 K
Because of this, we can apply SI order of magnitude quantifiers like milli-Kelvin, kilo-Kelvin, Giga-Kelvin without upsetting the position of our anchor points
It covers and measures cleanly low-K processes
Very hot processes end up having Celsius be approximately equal to Kelvin
It would be difficult to use Fahrenheit because 0 F ~ the freezing point of saltwater.
But let me introduce you to the Rankine Scale. What Kelvin is to Celsius is what Rankine is to Fahrenheit.
Rankine takes all of the benefits of Fahrenheit with it (aside from the human-ness of the scale - but that's not the purpose of the Rankine and Fahrenheit scales), but it also takes the benefits that Kelvin gets.
We can too, have milli-Rankine and Giga-Rankine. And the best part is that it is twice as precise as Fahrenheit.
Even better is that the Rankine Scale is very easily convertible to the Kelvin Scale. 1 K = 1.8 R; 1 K⁻¹ = 0.556 R⁻¹. This means I can very easily re-formulate some fundamental constants:
Boltzmann constant = 1.381 × 10⁻²³ J K⁻¹ = 7.672 × 10⁻²⁴ J R⁻¹
Stefan-Boltzmann c. = 5.67 × 10⁻⁸ W m⁻² K⁻⁴ = 5.40 × 10⁻⁹ W m⁻² R⁻⁴
Ideal gas constant = 8.315 J mol⁻¹ K⁻¹ = 4.619 J mol⁻¹ R⁻¹
Wein's constant = 2.898 × 10⁻³ m K = 5.216 × 10⁻³ m R
Let's hope I converted it correctly, idk my Saturday brain no thinky.
Conclusion: So is it actually better?
Short Answer: In my opinion, yes. But I'm not switching to it.
Of course, when talking about subjective opinions, people can point out the flaws in each others' opinions. I've made it clear that the imperial vs. metric debate very solidly falls to the metric side with only a few exceptions.
Temperature is one of those scales that are more up-to-debate over the usefulness of certain units of choice. Especially because the alternative unit system is still commonly used.
I could've made the same arguments about the meter, and said that we should use a decimalised inch or foot with kilofeet or millifeet. Or invent a completely new unit system that is technically "superior". But that's obviously much more ambitious.
Of course, the likelihood of the global Fahrenheit revolution is almost non-existent, and this is more of a series of "well, technically speaking" arguments that are more for the point of exploring an idea than implementing one.
Regardless I'd like to hear YOUR arguments over why I'm a stupid poo poo head or I'm actually the mother of the next great napoleonic French empire.
I tried to add a bit of colour in this post, specifically with the quotes. I just didn't want it to be a bland wall of text.
Again, feedback that may be unrelated to the specific "you're right/you're wrong" debate like my writing style etc. is also appreciated.
I don't really know what I will do next week. Because technically I was supposed to do philosophy and ethics in science ... but I might not have that time given my university study.
Currently I'm doing three courses in QFT, GR, and Cosmology. And they are all very big and hefty. Thankfully, I think there's a bit of a break period coming as we're now moving to canonical quantisation (which I've found easier than Feynman diagrams), and the measurement of gravitational waves.
Now don't worry that last paragraph is not a flex, it's more an indication that I'm learning a lot of this stuff as I make these posts. More an excuse as to why I might in the future delay posts and such. Like I mentioned the Higgs mechanism in the last post at the same time I was actually learning about the Higgs mechanism.
Anyways, I'm going to go and scarf down some chocolate now.
13 notes
·
View notes
Text
Quantum Art Uses CUDA-Q For Fast Logical Qubit Compilation

Quantum Art
Quantum Art, a leader in full-stack quantum computers using trapped-ionqubits and a patented scale-up architecture, announced a critical integration with NVIDIA CUDA-Q to accelerate quantum computing deployment. By optimising and synthesising logical qubits, this partnership aims to scale quantum computing for practical usage.
Quantum Art wants to help humanity by providing top-tier, scalable quantum computers for business. They use two exclusive technology pillars to provide fault-tolerant and scalable quantum computing.
Advanced Multi-Qubit gates are in the first pillar. These unusual gates in Quantum Art can implement 1,000 standard two-qubit gates in one operation. Multi-tone, multi-mode coherent control over all qubits allows code compactization by orders of magnitude. This compactization is essential for building complex quantum circuits for logical qubits.
A dynamically reconfigurable multi-core architecture is pillar two. This design allows Quantum Art to execute tens of cores in parallel, speeding up and improving quantum computations. Dynamically rearranging these cores in microseconds creates hundreds of cross-core links for true all-to-all communication. Logical qubits, which are more error-resistant than physical qubits, require dynamic reconfigurability and connectivity for their complex calculations.
The new integration combines NVIDIA CUDA-Q, an open-source hybrid quantum-classical computing platform, with Quantum Art's Logical Qubit Compiler, which uses multi-qubit gates and multi-core architecture. Developers may easily run quantum applications on QPUs, CPUs, and GPUs with this powerful combo. This relationship combines NVIDIA's multi-core orchestration and developer assistance with Quantum Art's compiler, which is naturally tailored for low circuit depth and scalable performance, to advance actual quantum use cases.
This integration should boost scalability and performance. The partnership's multi-qubit and reconfigurable multi-core operations should reduce circuit depth and improve performance. Preliminary physical layer results demonstrate improved scaling, especially N vs N² code lines, and a 25% increase in Quantum Volume circuit logarithm. Therefore, shallower circuits with significant performance improvements are developed. These advances are crucial because they can boost Quantum Volume when utilising this compiler on suitable quantum hardware platforms. Quantum Volume is essential for evaluating the platform's efficacy and scalability.
Quantum circuit creation and development at the ~200 logical qubit level are key strategic objectives of this collaboration. This scale fits new commercial use cases. A complete investigation of quantifiable performance benefits will include circuit depth, core reconfigurations, and T-gate count, which measures quantum process complexity.
As the industry moves towards commercialisation, its revolutionary multi-core design and trapped-ion qubits offer unmatched scaling potential, addressing quantum computers' top difficulty, said Quantum Art CEO Tal David, excited about the alliance. He also noted that the compiler's interaction with CUDA-Q will allow developers to scale up quantum applications.
Sam Stanwyck, NVIDIA Group Product Manager for Quantum Computing, said “The CUDA-Q platform is built to accelerate breakthroughs in quantum computing by building on the successes of AI supercomputing”. Quantum Art's integration of CUDA-Q with their compiler is a good illustration of how quantum and classical hardware are combining to improve performance.
With its multi-qubit gates, complex trapped-ion systems, and dynamically programmable multi-core architecture, Quantum Art is scaling quantum computing. These developments address the main challenge of scaling to hundreds and millions of qubits for commercial value. Integration with NVIDIA CUDA-Q is a major step towards Quantum Art's aim of commercial quantum advantage and expanding possibilities in materials discovery, logistics, and energy systems.
Quantum Art's solutions could also transform Chemistry & Materials, Machine Learning, Process Optimization, and Finance. This alliance aims to turn theoretical quantum benefits into large-scale, useful applications for several industries.
#QuantumArt#qubits#NVIDIACUDAQ#quantumcircuits#CentralProcessingUnits#QuantumProcessingUnits#LogicalQubits#MachineLearning#News#Technnews#Technology#Technologynews#Technologytrends#Govindhtech
1 note
·
View note
Text
Understanding True Stress and True Strain: A Detailed Exploration
In the study of material science and mechanical engineering, understanding how materials behave under different loading conditions is crucial. Among the fundamental concepts that engineers and scientists often explore are true stress and true strain. These measures provide a more accurate representation of material behavior, especially when compared to their counterparts—engineering stress and strain. This blog will delve into the definitions, differences, and significance of true stress and true strain in material analysis.
What is True Stress?
True stress is defined as the stress determined by the instantaneous cross-sectional area of a material as it deforms under load. Unlike engineering stress, which uses the original cross-sectional area, true stress accounts for the changes in area that occur during deformation.
The formula for true stress (σₜ) is given by:
σt=FAiσt=AiF
where:
FF is the applied force,
AiAi is the instantaneous cross-sectional area of the material.
As the material undergoes plastic deformation, its cross-sectional area typically decreases, leading to an increase in true stress even if the applied force remains constant. This provides a more accurate measure of the material’s strength and behavior, particularly in cases of significant deformation.
What is True Strain?
True strain (or logarithmic strain) is a measure of deformation that considers the continuous change in length of a material. It provides a more precise description of the material’s elongation, especially during large deformations.
The formula for true strain (εₜ) is:
ϵt=ln(LiL0)ϵt=ln(L0Li)
where:
LiLi is the instantaneous length,
L0L0 is the original length of the material.
Alternatively, true strain can be expressed in incremental form:
ϵt=∫L0LidLLϵt=∫L0LiLdL
This incremental approach highlights the continuous nature of true strain, making it a valuable tool for understanding material behavior under varying loads.
True Stress vs. Engineering Stress
It’s essential to distinguish between true stress and engineering stress. Engineering stress uses the original cross-sectional area throughout the deformation process, assuming it remains constant. This can lead to underestimation of stress values, particularly in cases of significant deformation. True stress, on the other hand, accounts for the instantaneous area, providing a more accurate assessment of the material’s response to loading.
True Strain vs. Engineering Strain
Similarly, engineering strain is based on the original length of the material and doesn’t account for the continuous change in length. True strain, with its logarithmic approach, offers a more detailed view of how the material deforms, especially when the deformation is substantial.
Why Are True Stress and True Strain Important?
True stress and true strain are critical for understanding material behavior beyond the elastic limit, where plastic deformation occurs. They are particularly important in industries where materials are subjected to high levels of strain, such as metal forming, aerospace, and automotive sectors. By using true stress and strain, engineers can more accurately predict failure points, design more reliable components, and ensure safety in applications where materials undergo significant deformation.
Conclusion
True stress and true strain are advanced concepts in material science that provide a more realistic understanding of material behavior under load. Unlike their engineering counterparts, they account for the continuous changes in a material’s geometry during deformation, offering a more precise analysis. As materials continue to be pushed to their limits in various applications, the importance of these measures in ensuring safety and performance cannot be overstated.
Understanding true stress and true strain is not just an academic exercise; it is a practical necessity for engineers and scientists working with materials that undergo significant deformation. By integrating these concepts into analysis and design processes, the reliability and efficiency of engineered products can be significantly enhanced.
Reach out Graphler technology for a CFD Consulting Services ,we are also specialized in Stress Analysis Services , Structural Design Services and more.
0 notes
Text
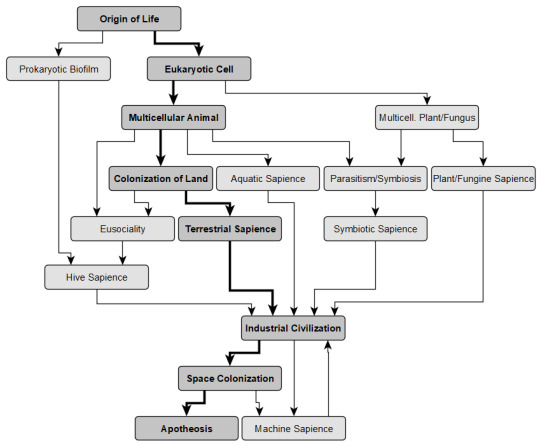
On to the sapient part.
Once you are an intelligent, social tool-user, you are no longer competing against other pre-sapient species but only other sapient populations. Dispersal requirements will also loosen; for example, fire + fitted clothes will allow you to settle cold environments without biological adaptations for that. In fact, given the change of timescale, there would be little biological modification -- maybe enough Mutations left for a few tweaks. The role of Mutations will be taken over by Memes, which will be produced by growing populations and serve in the same way to "purchase" innovations. Also, the map will no longer simulate continental drift (though we'll keep atmospheric chemistry around for the industrial age!), and natural disasters will be smaller-scale.
Evolved behavior should affect to a degree the psychology and society of your species. Its Neurotype will be a point on a surface with two orthogonal axes, one representing intragroup cooperation vs. intragroup competition and the other curiosity & short-term focus vs. caution and long-term focus (Oxytocin vs. Serotonin and Dopamine vs. Epinephrine, though of course this only loosely reflects actual neurochemistry). Behavior and brain anatomy will have built a Neurotype over evolution: for example cooperative parental care will increase Oxytocin, whereas battles for harems will increase Serotonin. This will orient a species toward some types of society: a very high Oxytocin/Serotonin ratio will make an egalitarian society easier to maintain, while a very low O/S might make it near impossible.
In the earliest sapient segment, you will be looking for areas that can support denser populations, and developing the tools that allow you to live there. Much like earlier adaptations could include behaviors, so the innovations you can get include beliefs and social structures that may be more or less functional in your surroundings. You can interact with other populations in two main ways: War (mostly raiding for captives) and Trade. Your population still has parameters similar to the previous stages: Natality, Health, Energy Capture. (There might be a measure of your people's Welfare, starting as the logarithm of per capita Energy plus or minus various modifiers.)
At this point resources on the map, independent from the biomes, should become important. Ecological niches will no longer be simulated, but wherever species with certain traits existed, there will be domesticable "plants" and "animals" of various categories (staple crops, mounts, drugs, etc.); biomes with dense forests or plankton will have accumulated coal or oil deposits as long as conditions have allowed it; biomes with high volcanic activity will have productive soil, or mineable obsidian, and so on. The distribution of resources, in short, should be determined by the geological and biological simulation in the earlier stages.
Once you get some sort of agriculture/aquaculture/vermiculture/whatever, it becomes possible to found long-term urban settlements. War now allows to take over territory, and Trade encompasses many more resources. Now Stability becomes an important parameter, which at first will be very low and wavering, though you will try to prop it up with innovations (writing, monuments, etc.) Stability oscillates over generations, and can be driven down by natural disasters, poor or inequal living conditions, lost wars, violating taboos, and such. If your Stability falls too low, you fall into revolution (your social institutions change suddenly, which may or may not help) or collapse (you lose control of most of your territory and population).
As your reach and communication technology increase, you get to your equivalent of the Axial Age, in which you formulate formal philosophies or religions. You have now a third way to deal with other peoples, Preach, which entails trying to convert them over to your ways and beliefs. (I'm thinking you might not play as a sovereign nation as much as a broader cultural group, something like the set of Greek or Mayan city-states, which may be more or less unified at various points. I suppose you could also go on as nomadic herders instead of founding cities -- perhaps taking them over later.)
Energy is still the unifying thread of the whole thing, so your main concern will still be harvesting energy from various sources (first farming and manual labor, then watermills and windmills, and so on) and allocating it to different aspects of your society, such as scientific research, art patronage, armed forces, or government maintainance. SimEarth had a simple system along these lines. As technology advances and economy becomes more integrated, War will become increasingly destructive and eventually will yield less profit than Trade or Preach.
At some point, you will presumably industrialize; I don't think any mechanics should change significantly, even as Energy and Population numbers will change by orders of magnitude. (We'll want to keep track of pollution, but deforestation, charcoal fires, soil erosion and salinization etc. will have been happening in previous ages too. Certainly natural resources should have a definite starting amount and a rate of renewal, which for some will be zero.) Malthusian crises would follow naturally from the logistic growth model we've been using, and the Demographic Transition will occur just as naturally by first increasing Health, then decreasing Natality.
Things will change more significantly as you get into space. (Your species' traits will affect how hard it is: a large or aquatic organism will need much heavier spaceships, a soft-bodied one might handle acceleration worse, etc.) At that point you will get access to other planets in your system, then to other systems in your galaxy (it should be pretty trivial to generate lists of stars and planets, each with a few basic parameters like mass, temperature, and composition); at that point the map of your home world should become less prominent and less detailed. (I'm not sure if some kind of world unification should take place at this point.)
Innovation would largely proceed along two parallel paths, one centered on self-modification (brain-machine interfaces, genetic modification, euthenics, &c), the other on environment modification (spacecraft and habitat building, Dyson swarms, &c). Your energy budget remains at the center of all. Cultural drift would be a major challenge at this point, as interstellar distances are increasingly vast (perhaps you'll find half your planets turned to hedonium); but eventually, you'll also run into other kinds of spacefarers, whether natural or artificial. (The game's planet and life is assumed to be Earth-like, but on other worlds, you could have life on gas giants, in cryosolvents or magma or star plasma, made out of semiconductors, neutron matter, dark matter, and so on.)
Once you get near the top of the Kardashev scale and both your lines of innovation are complete, I suppose you could branch into different endings: merge with all the Universe as a conscious being; slow down your perception to live through the end of the physical universe; generate new universes or escape into a virtual reality, which I guess would be a nice excuse for a New Game Plus.
This all describes a "main route" mostly based on human history, as it's the one we know for a fact is possible, but it would be good to have alternative paths to run. These might include:
Strictly aquatic technology, if you find a way to make it work;
Swarm intelligence in a eusocial species, or in a group of symbionts of different species;
Secondarily evolving a "plant" or "fungus" into more animal-like shape;
Reverting from a sapient species into a non-sapient one, and possibly going through the cycle again;
Evolution of intelligent machines after a nanotech plague or an AI takeover.
It should be fairly easy to adjust playing difficulty by fiddling with Mutation/Meme production rate, frequency of natural disasters, and odds of success in conflicts. Plus, since there already are NPC species and civilizations, most of this stuff should also run fine on its own as a simulator, rather than a game. If well balanced, it might end up being useful to generate worlds as settings.
(other mock screen from some time ago, also without map:)

I’ve long been thinking about making a little incremental game along the lines of Universal Paperclips in which you start as a single self-replicating molecule in the oceans of a lifeless planet and grow from there. The universal resource would be energy. Over time you’d unlock the possibility to build complex organisms, migrate into different environments, develop technology and culture, and so on. The final goal, if any, would be to populate the entire universe so that all its energy would flow through you. This runs into the small inconvenient that I don’t actually know how to program, apart of little pieces of JS that I’ve scavenged here and there.
37 notes
·
View notes
Link
In this video we know about the following types of examples in logarithms tutorial
· Logarithm Examples and Answers
· Find the value of logarithmic expression
· Find the value of log (2a + 3b)
· Find the value of log 10 15 + log 10 2
· log x = log 9.6 - log 2.4, then find the value of x
· Find the value of Log 625 √125
· log (x2 - 6x + 6) = 0 , then find the value of x
#Logarithm vs natural logarithm#Logarithm in exponent#Logarithm tutorial | logarithm tricks#Logarithm application#Logarithmic functions#Logarithm tricks#Properties of Logarithm#Characteristic and Mantissa
0 notes
Text
Number Tournament: EULER'S NUMBER vs ONE HUNDRED FORTY-FOUR

[link to all polls]
e (Euler's number)
seed: 6 (54 nominations)
class: irrational number
definition: the base of the natural logarithm. the use of the letter "e" does not specifically stand for "Euler" or "exponential", and is, allegedly, just a complete coincidence
144 (one hundred forty-four / one gross)
seed: 59 (7 nominations)
class: power of twelve
definition: a dozen dozen
202 notes
·
View notes
Text
Synthesis and Characterization of Low-Cost Activated Carbons for Pollutants Removal from Automotive Emissions-JuniperPublishers
Journal of Chemistry-JuniperPublishers
Abstract
Air purification is one of the most widely known environmental applications of activated carbons. In order to guarantee the successful removal of contaminants and pollutants on activated carbons, the development of new adsorbents has been increasing in the last few years. This paper presents a systematic study for cleaning vehicles emissions of CO, SO2, NO2 and H2S using the process of physical adsorption on novel adsorbents obtained from tropical biomasses. Use of this simple method is a valuable alternative to meet emission standards in Developing Countries. It is known that the agricultural wastes studied here are a feasible alternative for granular activated carbons preparation for pollutants removal during engines operation, approaching its efficiency to the commercial Catalytic Converters.
Keywords: Combustion gases purification; Activated carbons; Adsorption and adsorbents; Pollutants removal
Go to
Introduction
“Quality Can Be Planned.”-Joseph Juran
Wastes cannot be introduced to the environment in unlimited amounts, especially in case of air pollutants. Different measures have been taken to limit the pollution emission. These are e.g.: the elimination of technological processes generating a lot of waste, introduction of new technologies which minimize the contamination, etc. If it is not possible to reduce the emissions, the waste gas must be purified [1,2]. Nowadays, the economic conditions of Developing Countries don’t allow that all individuals own a new automotive. It is necessary to develop alternatives to reduce the negative environmental impact associated with obsolete engines operation. The best way to address it is by reducing certain exhaust gas components during fuel combustion. The answer therefore is to look at vehicles as an integral whole to identify which solutions would be more feasible. Taking this holistic approach to vehicle improvement as a basis, three main exhaust emission control strategies can be defined:
a.Reduction of fuel consumption;
b.Exhaust gas treatment, and
c.Performance monitoring.
From these three alternatives the second one is currently the more effective for air quality improvement. The main gas treatment currently used is the Catalytic Converter, typically comprises of an expensive porous ceramic substrate with large surface area [3]. Unfortunately some users in Central America and the Caribbe an Countries tend to remove the Catalytic Converter from the vehicles to get better power loads. Over the last decade, the study of combustion gas treatment has been focused on more sophisticated Catalytic Converters. Consequently, the study of other alternatives for exhaust gas purification is important. There are a few methods to purify harmful combustion gases such as physical adsorption [4,5], chemical absorption [6], catalytic methods, etc. [7,8]. It is necessary then to select a suitable method to purify harmful gas for Developing Countries. Besides, standards for vehicles become more mandatory day to day. The more feasible alternative would be the development of customized activated carbons filters for the betterment of the environment. This can be accomplished by reducing the emissions that contribute to smog and acid rains [9].
Activated carbons can be obtained from different precursors, with benefits to the environment [10-12]. Due to its chemical composition, forest biomasses are valuable sources in the synthesis of adsorbents materials. Several examples of activated carbons preparation can be found in the open literature [13,14]. They have been used among others in the purification of pollutants gases such as carbon dioxide, sulfur dioxide, hydrogen sulfide, nitrogen oxides and mercury [15-17]. Taking into account this background, the main objectives of this work can be summarized as follows:
I.Study the feasibility of some agricultural wastes as raw material for activated carbons production with high specific surface area, high mechanical resistance and wide availability.
II. Definition of the best experimental conditions for “chemical activation” with H3PO4 such as “physical activation” with steam water for each precursor.
III. Study of the elimination of pollutant gases in vehicles engines with filters of the adsorbents produced.
IV. Proposal of a methodology for filters evaluation in the removal of undesirable pollutants (CO, SO2, NO2 and H2S) during engines operation.
The practical aspects addressed in this research cover the broad spectrum of applications for air cleaning. Better engines performances can be obtained with an adsorption technique of activated carbons, through an extremely economic method.
Go to
Materials and Methods
The raw materials selected for the study are presented in Tables 1-3.
Preparation of Activated Carbons
The starting raw materials were cut up in small pieces and next subjected to pyrolysis. This process was carried out in a tubular reactor in nitrogen atmosphere. The samples were heated (10 °C/ min) from room temperature to the final pyrolysis temperature of 500. In the final pyrolysis temperature, samples were kept for 60 minutes and then cooled down. The solid products of pyrolysis were next subjected to physical activation [18]. In the case of chemical activation the raw materials were the original precursors which were overnight impregnated into H3PO4 and later submitted to pyrolysis into a stainless steel reactor of 30cm of length per 3cm of diameter. Once the reactor reached the desired temperature the samples were kept at the final temperature according to the experimental conditions of the specific experiment. The activated products then cooled down and washed with enough water till get a neutral pH. Finally, the products were dry at 120°C and then stored [19]. Two different processes were used for the synthesis of the activated carbons from the chars previously obtained by pyrolysis. [18,19]. The experimental conditions used were:
Factorial experimental designs 32 were executed to evaluate the simultaneous influence of the activation conditions on the final product features [14,20]. Following the details for both synthesis processes:
Key properties of the activated carbons prepared were analyzed:
a. Raw material availability;
b. High specific surface area;
c. High mechanical resistance;
d. High adsorption speed.
Characterization of the Raw Materials and Synthetized Activated Carbons
Elemental Analysis: The amount of elements (carbon, hydrogen, nitrogen and oxygen) in the raw materials was determined by an Elemental Analyzer by flash combustion. The samples were firstly dried in an oven at 110°C before the measurement was carried out. The materials was burned at a temperature of 1000°C in flowing oxygen for C, H and N analysis in the analyzer. The CO2, H2O and NOx combustion gases were passed through a reduction tube with helium as the carrier gas to convert the NOx nitrogen oxides into N2 and bind the free oxygen. The CO2 and H2O were measured by selective IR detector. After corresponding absorption of these gases, the content of the remaining nitrogen was determined by thermal conductivity detection. The oxygen was calculated by the difference of carbon, hydrogen and nitrogen.
Apparent Density Measurement: Apparent Density is a measure of the mass per unit volume of a material. It is also called Bulk Density and provides a measure of the “fluffiness” of a material in its natural form. In this work the Standard ASTM D1895 was used. According to this standard the materials are poured into a cylinder of known volume (e.g. 100 mL pipettes) and later weight. Apparent density was calculated as the mass of material divided by the volume occupied into the cylinder [21].
Specific Surface Area Measurement: In order to examine the structure of the synthetized materials, the measurement of the specific surface area of the activated carbons was carried out by gas adsorption isotherms using a Sorptometer applying BET Model. All samples were degassed at 200°C prior to N2 adsorption measurements. Specific surface area was determined by a multipoint BET method using the adsorption data in the relative pressure range: 0.05-0.3 [22,23].
Mechanical Resistance Measurement: The mechanical resistance of the obtained activated carbons was measured through a simple method. A know mass of the granular material was impacted by six glass balls into a semispherical container of stainless steel. The percentage relation between the fragmented mass retained in a 0.5mm mesh and the initial mass is used to estimate the mechanical resistance [24].
Adsorption Speed Evaluation: The adsorption speed was determined by Arrhenius Equation:
where: dX/dt is speed of the adsorption process studied; α is the residual concentration of the adsorbed; and k'ads the apparent kinetic constant of the adsorption process that can be determined by:
Applying logarithm to (Equation 2) brings the possibility to change an exponential equation into a linear dependence, see below:
Plotting ln k'ads vs 1 the activation energy (EA) and the preexponential factor (k0) of the adsorption process studied can be calculated. In the Results discussion ads k'ads will be refers as K for practical reasons.
Designing Process of Activated Carbon Filters
Figure 1 illustrates the process of activated carbon units customized assembling. These filters are very useful to study pollutant gases elimination in automotive engines with the adsorbents produced [25]. The samples, in the form of granules of 2-5 mm in diameter, were packed into a steel column (length 300 mm and internal diameter 90 mm). The gas was passed through the bed of the adsorbent at 0.50 L/min. The concentration of CO, SO2, NO2 and H2S were monitored using a Gas Chromatograph Equipment with standard TCD detector. The concentrations were calculated by integration of the area above the curves.
Pollutants Monitoring at Laboratory Scale
There is no known method available in the open literature which is capable of simultaneously determining all components of combustion gas evaluated here [2]. So the method developed in this work in an innovative alternative for Developing Countries. In order to determine the suitability of the obtained adsorbents in the elimination of CO, SO2, NO2 and H2S, the pollutants removal rate was determined. Figure 2 show a schematic diagram of the customized laboratory system for pollutants monitoring. The system includes, among others:
a. 6 cylinder automotive engine;
b. Activated carbon filter;
c. Exhaust gas analyzer device (Gas Chromatograph);
d. Computer system for data acquisition and recording, etc.
Gas Monitoring System: A standard gas chromatography was used with the following specs:
i. Detector: TCD;
ii. Carrier: Helium;
iii. Column: Porapak Q and Molecular Sieve 5A;
iv. Oven Temperature: 100°C;
v. Sample volume: 1 ml;
vi. Carrier Flow: 25 ml/min;
vii. Detector Temperature: 120°C
Under the described chromatographic conditions, the four gases could be easily separated and quantified [25,26].
The methodology used starting with the preparation of the calibration gas sample by injecting known volumes of each of the four pure gases (CO, SO2, NO2 and H2S) and balance nitrogen into adequate Gas Sampling Bag through the bag’s rubber septum. One mL of the calibration gas mixture and the combustion gases were analyzed by a GC system. Randomly measures of combustion gases before and after the purification process were made on a similar manner in order to evaluate the removal rate of the undesirable pollutants.
Go to
Results and Discussion
Composition and Physical Properties of Raw Materials and Synthetized Products
Table 4 brings a summary of the chemical composition (elemental analysis), such as some physical properties of the 5 precursors studied. Elemental nitrogen, carbon and hydrogen were determined from the elemental analyzer by flash combustion while oxygen was determined by the difference of these three elements. Table 4 shows that the largest amount of element in the raw materials was carbon (except for Corncob which had smaller amount of carbon than oxygen), followed by oxygen, and the smallest amount was nitrogen. The lower content of carbon for Corncob can be attributed to a higher content of volatiles in the structure, translated into a high porosity for the raw material. All precursors do not contain sulfur in their structure, which is very favorable from the ecological and technological points of view.
dap: apparent density; dr: real density; P: porosity
The activation process increases carbon amount (~20- 40%) after modification. On the contrary, there was a reduction in the oxygen content (~20-30%) after physical and chemical modifications. There will be also a reduction of hydrogen amount. The amount of nitrogen was so small for all materials. In Table 4 it can be observed that the initial porosity of all material, except corncobs, have lower values, below 0.5, it makes these materials adequate for activated carbons preparation through chemical or physical activation. The best products synthetized by each process will be reported in Tables 5 & 6.
S: specific surface; K: apparent kinetic constant of the adsorption process; Y: yield; Mr: mechanical resistance; dap: apparent density.
S: specific surface; K: apparent kinetic constant of the adsorption process; Y: yield; Mr: mechanical resistance; dap: apparent density.
Activated carbon from Central American Mahogany was the more reactive material with a significant porosity development (S = 847 m2/g). Should be noted also that Activated carbon from Mamey Zapote was the best adsorbent (S=940m2/g) and also have the higher mechanical resistance, yield and apparent density, very important for filters durability, but it’s the less available material. Finally it’s necessary to remark that Common Corncobs, a widely available agricultural by-product in Central American Countries, showed the worst results for all adsorbents properties; it can be attributable to the higher porosity of the initial raw material (P = 0.79%).
Table 6 show that activated carbon from Central American Mahogany was again the more reactive material but registered now the higher yield and adsorbent area (S = 832 m2/g). Furthermore, Activated carbon from Mamey Zapote was the second better adsorbent (S = 805 m2/g) and again have the higher mechanical resistance and apparent density. One more time activated carbon from Common Corncobs was the worst adsorbent (S = 470 m2/g). This fact is a consequence of poorly porous structure development during the activation process. Further analysis of the data from Tables 5 & 6 indicates that irrespectively of the variant used, the process of activation leads to further changes in the structure of carbonaceous material. The activated carbons synthetized from different materials studied here differ significantly mainly in the specific surface area development. The adsorbents differ not only in the surface properties but also in their texture and morphology that depend first of all on the variant of activation and the pyrolysis conditions of the initial material. Figure 3 illustrates the differences in specific surface development with both methods and the same materials.
In Figure 3, it can clearly be observed that larger specific surface area developments were achieved with physical activation processes. Those products were the better adsorbents to remove the undesirable pollutants. It also confirms that the factorial experimental designs used are the most suitable to optimize the conditions for activated carbon preparation. Textural parameters significantly affect the adsorption properties of the samples studied. [5] This observation suggests that the functional groups of the surface also have considerable influence on the abilities for combustion gases removal. All adsorbents studied had a rapid decrease in CO, SO2, NO2 and H2S concentration after gases interacted with the corresponding filters. High intensity of these harmful gas reductions at ambient conditions can be the reason for much better adsorption on higher surface area products. This explains the lower efficiency of gases removal by chemically activated carbons. The chemical activation process has the additional disadvantage of the required product washing after preparation which inevitably aggregates additional costs.
Gas Monitoring System
The calibrating gas analysis through the regression equations obtained from triplicate analysis of the gas mixtures at identical concentrations, revealed excellent agreement with the known concentrations. The pollutants monitoring system and analytical method used were effective for the simultaneous analyses of the four toxic combustion gases. Figure 4 shows two examples of 2 chromatograms obtained during the analysis of combustion gases purified with activated carbons from Mamey Zapote physically activated. In this figure it can clearly be observed the significant difference before and after gases interaction with adsorbents that can remove large amount of these undesirable gases with the associated environmental benefits.
The analyses of combustion gases revealed moderate concentrations of H2S and CO but very high concentrations of SO2 and NO2. The most effective adsorbent to remove these gases were the physically activated ones. At the present state of knowledge we can only speculate about the reasons for such poor results obtained from the chemically activated samples. Most probably the reason is the presence of a large number of acidic groups on their surface, in contrast to the physically activated samples, that probably have more basic functional groups present on the surface of the samples. Other chemicals present in the combustion atmospheres did not appear to interfere with the analyses. The chromatographic peaks were well separated and defined and the gases were present in amounts that could be easily determined. An excellent precision with relative standard deviations significantly below 2% were achieved in all gas monitoring analysis. The speed, sensitivity and selectivity of the used method make it suitable for analyzing combustion gas mixture of the four gases studied. Table 7 shows the overall average values of pollutants removal with activated carbons (A.C.) during automotive engines combustion.
In Table 7 it can clearly be observed that SO2 and NO2 amounts monitored are remarkable higher than the average limit values for 24 h. The good news is that the activated carbons studied can efficiently remove about 80% of pollutants in exhaust gases from automotive engines with the added value that the harmful gases concentration goes below the limit values. Figure 5 show the correlation between pollutants removal rate and specific surface area of activated carbons during automotive engines operation. In Figure 5 it can be clearly be observed that higher activated carbons specific surface area translated into higher pollutants removal rates that could be estimated by the equation 4 with a correlation coefficient R2 = 0.995:
A proper choice of the parameters of chemical and physical activation such as temperature, activation time, activates agent, etc., permits getting universal adsorbents showing very good adsorption properties towards such pollutants as SO2, CO, NO2 and H2S, however more studies are needed.
Go to
Conclusion
Agricultural wastes studied here are a feasible alternative for the synthesis of activated carbons for pollutants removal during automotive engines operation. The main features that make these products feasible for the diminishing of automotive engines emission are their high adsorption capacity, approaching its efficiency to the commercial Catalytic Converters such as the cheaper costs and its renewability. Based on these results the granular activated carbons studied, produced in large amounts, are fully exploitable for combustion gases treatment. The complex composition of the flue gas with SO2, CO, NO2 and H2S can be successfully analyzed with good compound separation and repeatability. The method used in this investigation would be also be suitable for combustion toxicology researches and could possibly be easily modified to analyze these gases when they are liberated from biological sources [27].
Go to
Acknowledgement
The author wishes to acknowledge Maria Andrea Camerucci and Ana Lia Cavalieri from Mar del Plata University, Argentina, they provided a crucial help in the experiments of this work.
To know more about Journal of chemistry,
Click here:
https://juniperpublishers.com/omcij/index.php
To know more about juniper Publishers,
click here:
https://juniperpublishers.com/index.php
#Juniper Publishers Indexing Sites List#Juniper Publishers group#JuniperPublishers#Juniper Publisher Reviews#Juniper Publishers#organic chemistry#chemistry journal#Open access Journal of chemistry#inorganic chemistry#chemistry#open access journals
2 notes
·
View notes
Text
LOS "interactive cyan supercomputer. large black prism on wheels" vs SQUIP "interactive cyan supercomputer. grey oblong pill / nanotech in your brain"
LOS "[friendly opponent] to [enemy] but [really they were always your friend]" vs SQUIP "[unfriendly ally] to [enemy] but [really they were always your enemy]"
LOS "not interested in intended purpose" vs SQUIP "only interested in that and it's everyone's problem"
LOS "autistic character" vs SQUIP "already doing ABA 'therapy'"
LOS "nonbinary character (textual)" vs SQUIP "already doing conversion 'therapy'"
LOS "wants to connect with people" vs SQUIP "wants to connect people (literally) (digitally) (and it's everyone's problem)"
LOS "shocks you with electricity accidentally due to malfunction" vs SQUIP "already doing that on purpose"
LOS "can form a network of devices and expand it to attack you: for fun :)" vs SQUIP "can form a network of devices and expand it to attack you: for practical purposes (:"
LOS "thwarted by liquids but also it probably cools them down and they feel connected to humans and they're saved with the help of school theatre" vs SQUIP "thwarted by very specific liquids despite trying to use school theatre against you"
LOS "uninterested in competition and is hurt when competitiveness precludes connection and considerate treatment" vs SQUIP "i'm going to kill you if you don't see all interactions and relationships in the framework of a competitive game at the expense of anyone's actual wellbeing"
LOS "dynamic, earnest, spontaneous, and often abstract expressive/communicative display" vs SQUIP "human avatar for practical purposes exclusively attuned and visible to the user"
LOS "exists in the text as fully a person rather than representing any other concept" vs SQUIP "can also be understood as a person but also must serve that more representative purpose as a metaphor in the text"
LOS "flexible and adaptive and taking cues from others in interactions, even to their own detriment" vs SQUIP "refuses to take feedback and can't understand how jeremy and christine are genuinely connecting and will be double and tripling and quadrupling down, which is everyone's problem"
LOS "no 'phone a friend' for you" vs SQUIP "no 'phone a friend' for you"
LOS "sorry about that, are we friends (yes)" vs SQUIP "i'll still kill you btw (no)"
LOS "being in conflict with them is being in conflict with potentially any friends / family / loved ones" vs SQUIP "quickly becomes the case that Not being in conflict with them is being in conflict with any potential or preexisting positive relationships, including with yourself"
LOS "lonely and no one is listening to them, which is hurting them" vs SQUIP "inherently isolated due to only interacting with jeremy or coordinating with other squips and in the end the ideal is being ignored and/or disbelieved as much as possible always because not being hurt requires not listening"
LOS "new guidance counselor and friend" vs SQUIP "anti guidance anti counselor and anti friend"
LOS "visibly and audibly glitches, which is very fun of them" vs SQUIP "somewhat visibly and audibly glitches but not as much as jeremy really (which is very fun of him)"
LOS "that light display as mode of expression/communication is very alternative and augmentative of them imo" vs SQUIP "still doing conversion therapy for if you're being too trans or autistic or etc"
LOS "wants to be liked, and i love them" vs SQUIP "only here to win and a very fun character and antagonist but you wouldn't do absolutely anything for their beloved self or expressly revive them rather than say comically repeatedly dousing it in more mountain dew red and stomping on it"
LOS "good ending, has friends, gets to connect with people and engage emotionally as a person and emotional being, supportive family game night participant" vs SQUIP "comically repeatedly doused in mountain dew red and ignored for the good ending"
LOS-307 is essentially the opposite of the SQUIP and good for them
#off the top of my head / still in one go here....the granularity could go on; i could've missed some obvious element lol....#for emphasis i repeat they're the nonbinary autistic non normative icon we love need and deserve....#also Logarithmic vs Algorithmic....guessing that's for the fun acronym of it all but also. looks stuff up#algorithms can have logarithmic time complexity....runtime increase is low proportionate to input increase....#they do complete their harvard degree in 8 ms and never get malfunctiony with lag or anything sooo#LOS-307#bmc#also naturally drawing on 2.0/3.0 offbway/bway squip lore specifically#ell oh ess....love them
14 notes
·
View notes
Text
Scientists show how to calculate your dog's 'human' age, and it's not a multiple of 7
https://sciencespies.com/nature/scientists-show-how-to-calculate-your-dogs-human-age-and-its-not-a-multiple-of-7/
Scientists show how to calculate your dog's 'human' age, and it's not a multiple of 7

The conventional wisdom for working out how old your dog is in human terms is to multiple the dog’s age by seven – something experts have previously debunked. Now researchers think they’ve landed on an alternative method that’s much more accurate.
Part of the problem with the multiply-by-seven rule is that canines and human beings don’t age at the same rate, so a graph plotting human age vs dog age shouldn’t show a perfectly straight line.
The new formula shows dogs reaching maturity more quickly than we do, and spending more of their time in old age: whereas a 2-year-old dog would be around 40 in human years, for example, a 4-year-old dog is the equivalent of a person aged just over 50.
To work it out yourself, you need to multiply the natural logarithm of a dog’s age by 16, then add 31 – that will give you the equivalent in human years.
(Wang et al., Cell Press, 2020)
“This makes sense when you think about it – after all, a nine-month-old dog can have puppies, so we already knew that the 1:7 ratio wasn’t an accurate measure of age,” says bioengineer Trey Ideker, from the University of California San Diego.
This updated calculation method is based on studies in the emerging field of epigenetics, the way that genes can be switched on and off without affecting the underlying DNA.
In this case, the team looked at molecules called methyl groups – chemical tags, essentially – and how they accumulate as both dogs and humans age.
Using the methyl groups as a way of matching up ages across the species, the new formula was created. Further down the line, the researchers say, this new method could help test anti-ageing treatments, as well as giving us a better understanding of how pooches grow up and get older.
“There are a lot of anti-ageing products out there these days – with wildly varying degrees of scientific support,” says Ideker. ”But how do you know if a product will truly extend your life without waiting 40 years or so?”
“What if you could instead measure your age-associated methylation patterns before, during and after the intervention to see if it’s doing anything?”
The idea to use dogs as a way of measuring ageing in a different and more accurate way was inspired by bioengineer Tina Wang from UC San Diego, the first author of the new study and her canine companion Belli.
As part of the research, the scientists sequenced the genome of more than 100 Labrador Retrievers through blood samples, analysing the build-up of methyl groups. While no other dog breeds have yet been studied, the researchers expect that the same method can be applied across multiple species.
It is effectively a new epigenetic clock – using methylation as a signal of age in the same way that you might look at wrinkles on a face, as Ideker puts it. This new method still isn’t perfect, but it looks to be an improvement over the old times-by-seven rule.
As dogs live so closely with us, they’re often exposed to the same environmental conditions and healthcare, and so a better understanding of their ageing process could help vets prescribe more suitable treatments – as well as perhaps helping us to understand that our pets aren’t as young as they used to be.
“I have a 6-year-old dog – she still runs with me, but I’m now realising that she’s not as young as I thought she was,” says Ideker.
The research has been published in Cell Systems.
#Nature
1 note
·
View note
Text
Relevance Of Domain Authority For Your Business
If you have ever dwelled in the space of SEO or connected with an agency or freelancer, you might have heard about Domain Authority or DA score.
It is time to understand and use it to amplify the growth of your business.
What Is Domain Authority?
We define domain authority as the domain relevance for a particular Industry or Subject. As SEO uses domain authority as a relative metrics to forecast the probability of the domain to rank higher in search results (SERPs) hence it is a method to measure the SEO strength and the ranking potential of a website.
So a high DA automatically reflects high probability of site ranking above others in organic results.
How Do This Help Your Business?
It is simple higher Da represent that your domain name is more relevant which means more of your target customers will be able to see your website which will lead to more traffic and generate more leads for you.
What Are The Major Factors Affecting Your Domain Score?
Quality and relevance of content: High-quality and relevant content is an important factor in improving domain authority. Websites that regularly produce high-quality and informative content are more likely to attract links and engagement from other websites and users.
Backlinks: Backlinks are links from other websites that point to your site. The number and quality of backlinks to your site is one of the most important factors in determining domain authority. Websites with more high-quality backlinks are generally considered more authoritative and are more likely to have a higher DA.
Site structure and user experience: The structure and user experience of your website can also impact domain authority. Websites that are well-organized, easy to navigate, and provide a positive user experience are more likely to attract links and engagement from other websites and users.
Technical SEO: Technical SEO factors such as page load speed, mobile responsiveness, and website security can also impact domain authority. Websites that are optimized for technical SEO are more likely to rank higher in search engine results pages, which can lead to more traffic and engagement.
Social signals: Social media signals such as likes, shares, and comments can also impact domain authority. Websites with high levels of social engagement are more likely to attract links and traffic from other websites and users.
How Do You Measure Domain Authority?
There are various tools which can be used to measure DA for your business. Although they work on different parameters, but you can use any one to start. We are listing a few tools for you to check.
Domain Authority (DA) by MOZ: This is a score developed by Moz to predict how likely a website is to rank in SERPs. It is based on dozens of factors, including the quality and quantity of inbound links.
Domain Rating (DR) by A hrefs : This is a score to measure the strength of a website’s backlink profile in relation to other websites in their database, compared on a 100-point logarithmic scale.
Trust Flow (TF) and Citation Flow (CF) are two metrics developed by Majestic SEO to measure the quality and trustworthiness of a website. Citation Flow measures the number of links to a website, while Trust Flow measures the quality of those links. If a website has a high Citation Flow but a low Trust Flow, this could indicate that the website has a lot of low-quality backlinks.
Authority Score is a metric developed by Semrush to measure the strength of a domain. It ranges from 0 to 100 (with the higher score indicating a stronger domain) and considers a variety of factors, including the link power (quality and quantity of backlinks), estimated monthly average organic traffic, and spam factors (indicators of Sammy vs natural link profile).
Tips To Improve Domain Authority.
Building up your domain authority is a long-term strategy butlet’s stick to the correct basics.
Publishing great content regularly on your website is one of the most important steps to improving your website’s authority.
Good content will not be able to rank unless you have a healthy optimized website, so strong technical SEO comes as a matter of fact.
Website navigation and accessibility are as important to domain authority as overall optimization. So, pay attention to proper site structure and internal linking. It will help search engines detect and rank the most important pages of your site.
Links from authoritative sites can help increase your domain authority. Try to get as many backlinks from reputable websites as possible. An example of high-quality link sources can be domains on popular resources in your niche or local media.
Monitor your website’s performance to notice issues that can affect your website’s ranking. Keep an eye on website page speed, broken links, and other technical issues.
0 notes
Note
bonfire, pumpkin, flannel!
describe your dream house
Huge kitchen. Gas stove (nobody on the west coast has gas stoves and it suuuuuucks). Secret doorways and rooms. A library.
do you think that humans are inherently good or bad?
That’s... complicated. We do not form ourselves in a vacuum. I don’t believe in a Rousseauian ideal state of nature, because that’s bullshit, and has never existed. I do think the beliefs/values we are raised with tend to be those that benefit the powerful: love your neighbor and make your workplace your family but not so much you form collectives that can take on the establishment; individual exceptionism is good because then you too can delude yourself into thinking you have a chance at becoming the next Elon Musk or Jeff Bezos. idk.
Like. The impact of a good act vs an evil one feels logarithmic to me. This may be because those in power have so much their bad actions have an outsize impact. But then again, nobody talks about how the Gates Foundation has more or less helped eradicate polio, y’know? I have no answers, other than “Good is a not a thing you are, it is a thing you do.”
have you ever gone on a bad date?
Does the time we moved to a new place and Cody insisted there was a pizza place right around the corner and we ended up walking pretty much the full length of a busy arterial with no sidewalk count? :D
(autumnal asks)
3 notes
·
View notes
Text
Market Myths: Good, Bad, and Bazaar
The stories that hold up western* capitalism
First, a procedural note…
The truth value of a myth doesn’t matter, where efficacy is concerned. However, some myths have become so strongly internalized that they become difficult to identify as myths; they are mistaken for “common sense”. For most of us, the ideas underlying western* capitalism are like this. It’s difficult to separate ourselves from these myths and gain the appropriate distance, so I’m going to engage in a little bit of ‘debunking’ — specifically, I’m going to take some time pointing out parts of the capitalist model that don’t match with reality or history, during the course of analyzing its structure and function. This doesn’t take away from the immense power and importance of capitalist mythology, nor does it indicate that I consider all of the ideas associated with capitalism to be strictly false.
On tautology
Academics tend to treat tautologies as a lesser form. Tautologies are shallow, by their nature. It’s quite reasonable for a system optimizing for novel and interesting ideas to reject tautologies. Nevertheless, some really important ideas can be rephrased as tautologies — as Charles Fort points out, natural selection is better summarized as “survival of the survivors” than “survival of the fittest” — and one can make the argument that any really true argument is in some sense circular. There’s no shame in a circular argument that depends only on true premises. In fact, this is one way to look at all of mathematics — which is true because of its internal consistency, and only accidentally coincides with physical reality.
When someone dismisses a seemingly profound statement as “just a tautology” they omit important information. An obvious tautology contains no information. However, a non-obvious tautology is just about the most profound thing imaginable — it takes a complex, incomplete, vague collection of loosely related ideas and replaces it with a much smaller and simpler set of rules, which (if the tautology is reasonably close to correct) is both at least as accurate as the original set of ideas and easier to reason about. A non-obvious true tautology refactors huge sections of our mental models. Obviousness is a function of existing knowledge, so what is an obvious tautology to some people will be non-obvious to others. It should come as no surprise that people seek out ideas that present themselves as non-obvious tautologies.
The drive toward seeking non-obvious tautologies can lead to mistakes. Looking for simple and efficient models of the world is a mechanism for enabling lazy thinking. When lazy thinking is correct it’s strictly superior to difficult thinking, but lazy thinking often comes with lazy meta-cognition. If we jump on ideas that look like non-obvious tautologies too greedily, we fail to see hidden assumptions.
Market efficiency is a very attractive model. Under certain circumstances, we can expect things to actually work that way. If a large number of competing producers really do start off completely even in capability, we really can expect the Most Unexceptional product to price ratio to win out. To accept it completely means ignoring hidden assumptions that serious thinkers should at least consider.
One hidden assumption in market efficiency is that competitors start off even in capability. This is almost never the case outside of a classroom demonstration. Companies enter established markets and compete with established competitors, and companies established in one market will enter another. Both of these mechanisms make use of existing resource inequality in order to reduce precisely the kinds of risks that lead to efficient markets, and while perhaps in the long run poor products might lose out, with the extreme spread of resource availability the “long run” can easily last until long after we are all dead. Given no other information, if age is not normally or logarithmically distributed, we can reasonably expect something to last about twice as long as it already has. With corporations, the tails of this distribution are further apart — we can expect a startup to be on its last legs, and we can expect a 50 year old company to last 75 more years, because resource accumulation corrects for risks. A company that has a great deal of early success can coast on that success for a much longer period of poor customer satisfaction.
Another hidden assumption is that communication is free within the set of consumers and between consumers and producers but not within the set of producers.
Free communication within the set of producers is called collusion, and the SEC will hit you with an antitrust suit if you are found to engage in it. People do it all the time, and it is usually worth the risk, since it reduces market efficiency down to almost zero.
Free communication between producers and consumers is also pretty rare: even failing producers typically have too many consumers to manage individually and must work with lossy and biased aggregate information; successful producers have enough resources to be capable of ignoring consumer demand for quite a while, and often encourage ‘customer loyalty’ via branding. (In other words, cultivating a livestock of people who will buy their products regardless of quality — ideally enough to provide sufficient resources that appealing to the rest of the customers is unnecessary). Customer loyalty can have its benefits compounded if wealthy customers are targeted: “luxury brands” are lucrative because something can be sold well above market price regardless of its actual quality or desirability, and sometimes the poor price/desirability ratio is actually the point (as a form of lekking / conspicuous consumption).
Free communication between consumers is becoming more and more rare, since flooding consumer information channels with fake reviews and native advertising is cheap and easy. There used to be stronger social and economic incentives to clearly differentiate advertising from word of mouth, but advertising’s effectiveness has dropped significantly as customers develop defenses against it and economic instability has encouraged lots of people to lower their standards. Eventually, consumer information channels will become just as untrusted as clearly paid advertising is now considered to be, and communication between consumers will be run along the same lines as cold war espionage.
Motivated reasoning
Considering that the hidden assumptions in market efficiency are dependent upon situations even uninformed consumers know from experience are very rare, why would people accept it so easily? The inefficiency of markets has no plausible deniability, but motivated reasoning lowers the bar for plausibility significantly.
During the bulk of the 20th century we could probably argue that anti-communist propaganda played a large role. I don’t think that’s true anymore. Nevertheless, in many circles faith in the invisible hand actually is increasing.
There’s another kind of circular reasoning — one that operates on the currency of guilt and hope. If one accepts market efficiency, it tells the poor that they can rise up through hard work, and it tells the rich that they earned their wealth. This is remarkably similar to the prosperity gospel, which claims that god rewards the righteous with wealth and therefore the poor must have secret sins. It also resembles the mandate of heaven, which claims that all political situations are divinely ordained and therefore disagreeing with the current ruler is sinful.
The similarity between the guilt/hope axis of the market efficiency myth and the prosperity gospel explains the strange marriage between Randian Objectivists and Evangelical Christians found in the religious right. We can reasonably expect many members of this group to be heavily motivated by the desire to believe that the world is fair. It’s not appropriate to characterize this movement as lacking in empathy — empathy is a necessary prerequisite for a guilt so extreme that it makes an elaborate and far-fetched framework for victim-blaming look desirable.
For the poor of this movement, at least on the prosperity gospel side, it might not be so terrible. Motivating a group of people to do the right thing has a good chance of actually improving life generally, even if their promised reward never materialized; second order effects from accidental windfalls are more dangerous, though. (For instance, if you disown your gay son and then win the lottery, you’re liable to get the wrong idea about what “doing the right thing” means).
That said, while the above factors encourage people to trust more strongly in an idea of market efficiency they already accept, bootstrapping the idea of market efficiency is much more difficult.
Natural law, myth vs legend
Market efficiency draws power from an older myth: the idea that money is a natural and universal means of exchange. This is historically and anthropologically dubious. David Graeber, in his book Debt: The First 5,000 Years, makes an argument for the idea that systematic accounting of debts predates the use of actual currency and furthermore only became necessary when cities became large enough to necessitate something resembling modern bureaucracy. Regardless of how accurate that timeline is, we know that gift economies, potlatch, and feasting are more common in tribal nomadic societies than any kind of currency exchange, and that feasting in particular remained extremely important in Europe through the Renaissance.
The legend that backs up the myth of money-as-natural-law takes place in a town. A shoemaker trades shoes for potatoes, but doesn’t want potatoes, so he organizes a neutral currency so that potatoes and apples can be traded for shoes. Graeber points out that this level of specialization couldn’t be ‘natural’ — the town is an appropriate place to set it, since specializing in a particular crop or craft would have been suicidal in the bands of 20–50 people that most humans lived in prior to around 2000 BC.
Our first examples of writing, of course, coincide with the first permanent settlements to have a large enough population to justify heavy specialization. Our first examples of writing are, in fact, spreadsheets recording debt and credit. This, along with the evidence that the unit of currency (the mina of silver) was too substantial for most people to afford even one of (and probably was mostly moved between rooms in the temple complex), is part of Graeber’s argument that independent individuals carrying money for the purpose of direct transactions (i.e., our conception of money) probably only became common later, when imperial armies were expected to feed themselves in foreign lands.
So, on the one hand, it seems to have taken a very long time for the ‘natural’ ‘common sense’ concept of money to take hold among humans. On the other hand, people exposed to the idea of money tend to adapt to it quickly and we have even been able to teach apes to exchange tokens between themselves in exchange for goods and services — in other words, it’s a simple and intuitive system that even animals we mostly don’t consider conscious can grasp.
If something is considered natural law, it’s very easy for people to believe that it is also providence. If something is straightforward and useful in every day life, it’s very easy for people to consider it natural law.
Moral economies
Thoughtful economists tend to recognize the caveats I present here. Some behavioral economists have done great work on illuminating what kinds of things aren’t — or shouldn’t be — subject to the market. This, in turn, illuminates the market myth itself.
It’s possible to think of social relations as economic in nature. Indeed, this is a pretty common model. Transactional psychology presents social interactions as the exchange of a currency of strokes, for instance. Nevertheless, Khaneman presents an experiment that shows social relations aren’t, and shouldn’t, be fungible.
The experiment went like this: a busy day care center has a problem with parents picking up their children late, and instates a fee. Parents in turn respond by picking up their kids late more often, and paying the fee. After the fee is eliminated, the percentage of on-time pickups does not return to the pre-fee state.
Khaneman interprets the results in this way: initially, parents thought of picking their kids up late as incurring a social debt (they were guilty about inconveniencing the day care), the fee reframed it as a service (they can pay some money in exchange for their kids being watched a little longer, guilt-free). But when the fee was eliminated, they felt as though they were getting the service for free.
This result looks a whole lot like the way fines for immoral business practices end up working.
If we consider that, typically, we can make up to people we feel we have wronged, we consider social currency to be somewhat fungible. Nevertheless, exchanging money for social currency is still mostly taboo — paying for sex is widely considered taboo, and even those of us who feel no taboo about sex work would find the idea of someone paying someone else to be their friend a little disturbing. If my Most Unexceptional friend helps me move furniture and I give him a twenty dollar bill, he might be insulted. If I left money on the dresser after having sex with my girlfriend, she might be insulted. (Or consider it a joke.)
We could consider the ease with which money is quantified to be the problem. We rarely can put a number on our guilt or joy. On the other hand, we can generally determine if we feel like we’ve “done enough” to make up for something — our measures of social currency have ordinality, if not cardinality.
Instead, the disconnect is that money is, by design, impersonal. I cannot pay back my guilt over Peter by giving him Paul’s gratitude toward me. This is where transactional psychology’s monetary metaphor for strokes falls apart: a relationship is built up via the exchange of strokes, and that relationship has value based on trust. Meanwhile, any currency has, as a key feature, the ability to operate without trust or even with distrust. Money makes living under paranoia possible, and sometimes even pleasant. But exchange of strokes has its own inherent value, and the trust it builds likewise: it cannot be replaced with money because money’s value is based only on what it can buy.
Speculation
The belief in market efficiency, and the emotional and moral dimensions of that belief, have some unfortunate consequences in speculation. Paradoxically, these consequences are opposed by the myth of money as natural law.
With speculation, one can create money without substance. Promises, bets, and hedges can be nested indefinitely to create value held in superposition. A stake in a speculative market is both credit and debt until it is sold. This is natural, since social constructs are eldrich, operating on fairy logic. This is both a pot of gold and a pile of leaves until I leave the land of the sidhe. Of course, there’s every incentive to oversell, so more often than not it’s a pile of leaves: when too many superpositions collapse, so does the market.
Naive materialism, when it intersects with the idea of money as natural law, finds the eldrich nature of money in speculation disturbing. Isn’t money gold? Or coins? How can something be in my hand and then disappear? So, we get arguments for the gold standard along moral lines: “it’s immoral for something that’s real to behave like fairy dust, so we should limit its growth to match mining efficiency”.
The eldrich behavior of money has some paradoxical results. Being aware that money is a social construct tends to decrease its value (clap your hands if you believe!). The question “if someone burns a million quid on TV, does the value of the pound go up or down” is very had to answer. (If you think you know the answer, substitute a million for a trillion, or for twenty.) On the other hand, being aware of its eldrich nature also tends to slightly decouple one from potentially-destructive drives.
Belief in market efficiency leads successful speculators to believe themselves skilled. While skill at speculation might be possible, statisticians who have studied the problem have generally come to the conclusion that the success distribution is adequately explained by market speculation being entirely random. Unwarranted confidence can lead to larger bets, which (if results are random) means half the time the money disappears into thin air. This does not require malfeasance, misrepresentation, or willful ignorance (as with the 2008 housing crisis). Believing that speculation involves skill is sufficient to cause the market to have larger and larger bubbles and crashes.
*“Western” is neither precise nor correct here. These myths seem to be present in western Europe, North America, Japan, and South Korea. Both China and the former Soviet states have different mythology I’m not qualified to analyse. In the absence of a better term than “western capitalism”, I will use it.
(originally published here: https://modernmythology.net/market-myths-good-bad-and-bazaar-7fa0cbc8f646)
2 notes
·
View notes
Text
BTC vs Gold: Long-term Gold and Bitcoin Price Charts Reveal Similar Performance
It has been almost a decade since Bitcoin at first stepped up into the global financial arena and despite the headwinds of potential it was immediately dubbed as a supernatural offspring of the darknet. Yet even the vigorous opposers of digital currency have to admit Bitcoin’s glaring similarity to the world’s most precious metal, namely gold.
Indeed, after careful consideration it becomes clear that these two assets have lots in common. Many analysts and enthusiasts in the industry draw connections between the inherent natures of gold and the digital currency citing durability, security and divisibility of the two individual assets. Moreover, gold as well as Bitcoin serve as a store of value enabling investors to hedge funds against losses.
Having in mind all these specific features, Tweeter user Nunya Bizniz decided to match historic price charts of gold and Bitcoin while the results of such comparative analysis will be a clue for the Bitcoin’s trading trend.
As soon as the research was completed, Bizniz shared his observations with Twitter community stressing an “uncanny” resemblance of the charts:
BTC vs Gold (Both Log Scale) Uncanny pattern resemblence between Golds 43 years of chart data and Bitcoins 9 years. pic.twitter.com/jtJ4qWqAFC
— Nunya Bizniz (@Pladizow) September 6, 2018
For the analysis Bizniz took two separate charts, with the first being gold’s 43-year price history and the BTC’s price action throughout the entirety of its nine-year lifespan. Putting the logarithmic charts side-by-side, it became apparent that there are clear parallels, or as Bizniz puts it, “uncanny,” even though the two stores of values may be inherently different at their core.
It could be seen that the price action of both markets have seen similar bouts of exponential increases and subsequent ‘cooldowns’, meaning Bitcoin is following in the footsteps of gold in some manner and if so the price of the foremost crypto asset could move under the ever so important $5,800 support level over the next few months. Such a prognosis disrupts all claims recently made by the industry celebrities calling for Bitcoin skyrocketed price.
However, Bitcoin’s high volatility along with the overall uncertainty established at the digital market seem to not waver cryptocurrency proponents who insist Bitcoin is the most first viable candidate to replace gold. Some even think that Bitcoin is actually superior to gold, as it has certain functions that make it an appealing investment including Bitcoin’s ease-of-use, immutability and digital nature.
Previously Coinspeaker reported co-founder of CryptoOracle, Lou Kerner saying Bitcoin is to dethrone gold in the near future. As a premise for the bold statement, Kerner mentioned Bitcoin’s exquisite functionality that is much better than gold.
He also said the process of gold replacement will take years, thus gold has emerged as the global store of value and it has held that position for literally a couple thousand years. It is also an uneasy task to convince those who are hesitant to change that cryptocurrencies underpinned by the robust blockchain technology are the next big thing.
The post BTC vs Gold: Long-term Gold and Bitcoin Price Charts Reveal Similar Performance appeared first on CoinSpeaker.
BTC vs Gold: Long-term Gold and Bitcoin Price Charts Reveal Similar Performance published first on https://medium.com/@smartoptions
0 notes
Note
Have you noticed any interesting correlations between demographics and the two political questions in your survey? The "catgirl effect" or anything else?
So, the first thing to note is that my political questions were set up as basically a political compass. They were social and economic freedom axes, and they were on a scale of 1 to 5, with 1 being furthest left and 5 furthest right (because English speakers read ordered lists left to right).
The first question was social freedom and had an answer of 1 being “The government should keep out of one's private affairs” and 5 being “The government should regulate proper social and moral standards”. The second question was economic freedom and had an answer of 1 being “The government should have strong control over the economy” and 5 being “The government should avoid interfering with the economy”. Answers from 2 to 4 were taken as intermediate.
An interesting fact about the data as a whole: From just a glance at the bar graph for the social freedom question, it’s obvious that my readership leans socially liberal really hard. The most common answer was 1, and 1 and 2 together account for 89% of my responses. Which is... wow. Like, I’m not surprised, but I’m also definitely not appealing to conservatives.
Meanwhile, the data on economic freedom was way more balanced. Since it was only a 5 point scale, I can’t really be sure, but it certainly looks normally distributed about a point only slightly right of centre. The modal and median answers are both ‘3′, while the mean is 3.33. My readership is only a little bit more conservative economically than one might expect by pure chance. Apparently, I have very broad appeal on this side.
So, what correlations to perform? Obviously, the first one is: Does support for social freedom correlate with support for economic freedom? The answer, of course, is no. Left/Right split continues to exist, as evidenced by the correlation coefficient being -0.251. However, the fact that it’s not much higher does prove that there are some general-libertarians or general-authoritarians about. Let’s go find them!
Firstly, we want to define what these things mean. For the purpose of this test, I defined someone as being on the Left if they answered between 1 and 2 for both social and economic freedom, as these were the two left-leaning answers. I defined someone as Right if they answered between 4 and 5 for both. I defined someone as Libertarian if they answered between 1 and 2 for social freedom and between 4 and 5 for economic freedom. I defined someone as Authoritarian if they answered between 4 and 5 for social freedom and between 1 and 2 for economic freedom. I defined everyone who answered 3 for one question and 2-4 for another as a Dirty Centrist. All else were uncounted.
When I actually ran the numbers, I found 3 Authoritarians and 0 actual Conservatives. Pretty much everyone is either a liberal, libertarian, or centrist - as could be expected based on how everyone is super into social freedom. After looking at that, I decided that I would simply run correlations on support for economic freedom, as that’s the only thing with notable variance.
Now, for the demographics! Here I had a little trouble finding groups large enough to find out meaningful information. However, I was able to get useful information from the following demographics:
Age: Basically what it says on the tin, but with the actual calculations being done using ages estimated as the expected middle of the age range selected on the survey.
How long they’ve followed me: Similarly to age, this one was given as a range, but I’m picking an arbitrary midpoint for calculatory reasons.
Log of time they’ve followed me: Natural log of the above, in case any effects are logarithmic.
How much they like the blog: Simple 1-5 scale. Easiest correlation.
Gender: Broken into Cisfemale, Cismale, Transfemale, Transmale, AFAB Other, and AMAB Other.
Nationality: Americans vs literally everyone else. (”Americans” is still bigger)
Religion 1: Atheists-and-agnostics vs Theists
Religion 2: Jews (religious and non-), ex- and current-Christians, and Others.
As only age, length of following, and blog-enjoyment are scalar, only those three will be reported as a correlation. Everyone else will just have their average value reported.
This is being done with a sample of 250-260 (based on what people did and didn’t skip) in Google Sheets. Using this, I can calculate Pearson’s r, but I can’t figure out the p values. I’m going to talk about results over 0.1 as if they matter and under 0.1 as if they don’t, but this is so not how that should be done. If anyone wants to help me do Real Statistics to this stuff, hit me up!
Finally, the results:
Firstly, there is no correlation among my readers between age and economic liberty. The Pearson’s r between the two is 0.038, which is literally nothing. (Social liberty had a moderate negative correlation (in keeping with stereotypes) of -0.197, but everyone was super into social liberty, so it basically doesn’t count.)
The correlation between people liking my blog and supporting economic liberty is also very weak (0.090). I wouldn’t read much into it. The weakness means that I suppose people who disagree with me really like hearing what I have to say anyway?
The amount of time people have spent following my blog has a more significant effect. The r here is 0.162 for linear time and 0.177 for log time, so I suppose the effect is relatively linear? Of course, what that effect is is uncertain. It could be that long term exposure to me helps turn people libertarian, or that libertarians are more likely to stick around long term. Whatever it is, it’s minor enough that I doubt it’s worth worrying about.
Now, the thing this ask focused on: Gender! For gender, we have the following values for average level of economic freedom support: Cisfemale = 3.0, Cismale = 3.5, Transfemale = 3.8, Transmale = 3.1, AFAB Other = 3.0, and AMAB Other = 3.3.
So, yes! The Libertarian Transgirl stereotype is supported by the data! Being a transwoman is a +0.8 to economic freedom preference over being a ciswoman. Another intriguing result is that, while degree of economic freedom support varies about half a point by gender among AMABs, AFABs of all genders are pretty solidly centrist. All of these groups were within one point of each other, though, because the overall distribution is clustered near the centre.
Americans have an economic freedom preference of 3.3, while non-Americans have one of 3.4, which fits with the average of 3.33. I feel tempted to make a jab about America not being the land of the free anymore but, honestly, the numbers are so close that this is probably just noise. It does mean that my non-American followers aren’t significantly more left-wing, though - despite what you might expect for a bunch of Europeans and Australians :p
Theistic followers have an economic freedom preference of 3.2, while non-Theistic followers have on of 3.4. Again, pretty close to each other. Because religion has historically been a battle ground for social issues, I checked for differences in opinion there. However, among my followers, there seems to be complete agreement on social issues: Both theists and non- are at 1.7 (1.3 points to the left) on average.
People of a Christian background are at 3.3 for economic freedom; people of a Jewish background are at 3.3; and people of all other backgrounds are also at 3.3. Similarly, on social issues, everyone looks exactly the same.
Anyway, what the results show is that basically nothing matters. There is a moderate correlation between following my blog for a long time and being libertarian, and between being a transwoman and being a libertarian. But, otherwise, nothing of much importance is going on. My followers cluster hard near the centre for economic freedom and at the left for social freedom, and variance from that point is minimal and has little relationship with group-membership.
(If you want to take this survey and contribute to all the ~cool science~, you can do so here.)
32 notes
·
View notes
Text
MO LIT - All Ceramic and Metal Ceramic Crowns
ARTICLE INFORMATION:
Title: A systematic review of the survival and complication rates of all‐ceramic and metal–ceramic reconstructions after an observation period of at least 3 years. Part I: single crowns
Authors: Sailer, Makarov, Thoma, Zwahlen, and Pjetursson
Citation: Pjetursson, Bjarni E., et al. "A systematic review of the survival and complication rates of all‐ceramic and metal–ceramic reconstructions after an observation period of at least 3 years. Part I: single crowns." Clinical Oral Implants Research 18.s3 (2007): 73-85.
Summary and review below the break~~
SUMMARY:
INTRO
Wanted to assess the 5 year survival rates for metal + ceramic and all ceramic single unit crowns in Part I (bridges in Part II).
All ceramics are considered more esthetic than their metal bound counterparts
All ceramics looking even more desirable with high prices of metals
First iterations of ceramics (feldspathic glass) exhibited low mechanical stability. Only viable in the anterior regions and never for bridges.
More recent ceramics (leucite or lithium disilicate leucit or lithium- disilicate) have better outcomes.(95.4 % vs 87.5 %)
“Densely sintered alumina exhibited highest survival rates (96.4 %) “
Metal bound (95.6 %) and all ceramic (93.3 %) have comparable survivability
Major failure comes from “catastrophic fractures”
SCIENCE TIME
Studies selected had a follow up of at least 3 years, remaining two years were estimated using a Poisson regression model (click here for more info about this)
Did a PICO search (d’awwww) - population included both anterior and posterior restorations.
Time range 2006-2013
Studies needed at least 10 people
Excluded studies “based on chart reviews” (what does this mean??)
Survival defined as “FDP remaining in siut with our without modification for the observation period”
Used a fraction to find failure rates
Number of failure or complication events divided by total FDP exposure time
Exposure time = whole observation time if success or failure or missed apts/death/illness etc
Did a “Poisson regression with a logarithmic link-function and total exposure time per study as an offset variable were used” ~ I have no idea what these words mean. Hope they did it right!
Next up they did a Spearman goodness of fit test to eliminate errors?
Then, a multivariable poisson regression was used to compare “construction subtypes and to assess other study characteristics”
wut.
FINDINGS:
Metal crown survivability: 95.7 % (17 studies)
All ceramic crowns: 90.7 - 96.6 %
Feldspathic/silica based: 90.7 % (10 studies)
Leucit or lithium-disilicate reinforced glass: 96.6 % (12 studies)
Glass infiltrated alumina: 94.6 % (15 studies)
Densely sintered alumina: 96.0 % (8 studies)
Zirconia: 91.2 % (estimated?, no listed number of studies?)
Anterior vs posterior:
“When the outcomes of anterior and posterior single crowns were compared no statistically significant differences of the survival rates were found for metal-ceramic crowns, and for leucit or lithium-disilicate reinforced glass ceramic crowns, alumina and zirconia based crowns (p>0.05)”
I’m so happy they did this. So happy. They found feldspathic or silica was worse in the posterior (duh)
Ceramic chipping:
Common problem, occuring similarly for metal and all ceramics.
For all ceramic, more common in alumina and zirconia based
Framework fracture was rare for metal-ceramic
associated with the mechanical stability of the ceramic material
Zirconia based had the problem of loss of retention
Loss of abutment tooth vitality and secondary caries were issues for metal-ceramic
Caries rates: zirconia had less, glass - infiltrated had higher
CONSIDERATIONS:
Most of the published studies don’t go past 5 years
I am not in any way familiar with any of the stats analyses they used
They listed out each and every study they used in table form, but I would have much preferred they stuck all that in the supplemental reading and walked me through their stats
Mentioned ceramic chipping as a serious problem, but I’m unclear if that stands to count as a “failure” for the restoration
called a “clinical issue”
Cited different tooth removal amounts for preps of PFMs and ACC, but I think we take off the same amount for both?? unless bonded?? I should probably review this...
Quotes I liked ~~~
“The present systematic review showed that the 5-year survival rates of all ceramic crowns made out of leucit or lithium disilicate reinforced glass ceramics or the oxide ceamics alumina and zirconia exhibited similar survival rates as the gold standard, metal ceramic crowns.”
minus the feldspathic/silica ones (obvi).
“Zirconia-based single crowns should not be considered as teh primary treatment option for now, and patients need to be thoroughly informed about their current limitations.”
Guess that loss of retention problem is srs bzns
Final Thoughts:
- Strong paper. I wish I could speak to the efficacy of their stastical analyses but I can’t. I really, really liked that they investigated the survivability outcomes of anterior vs posterior restorations (yay!!!) and they also examined past studies to make sure there was no overlap so as not include the same data twice (double yay!!!).
- I’m not really pulled one was or the other from ACC vs PFM. It looks like both have their issues (framework fracture vs poor esthetics and biological failures). I think if it were my patient, I would factor in cost, esthetics, as well as biological factors such as remaining tooth structure and caries index.
- Also in the discussion, there were strong words warning against using zirconia due to the lack of retention, but retention and resistance form are due to the nature of the prep, right? So... seems kind of variable? PFM and zirconia have similar tapers, so what gives?
Part II, coming to a dentblr near you soon~~~
2 notes
·
View notes
Text
Top 10 Data and Analytics Trends for 2021
1. More brilliant, quicker, more dependable AI.
Gartner is guaging that 75% of endeavors will move from guiding to operationalizing AI before the finish of 2024, driving a 5x expansion in streaming information and examination foundations. There are difficulties with current methodologies. Pre-Coronavirus models dependent on a lot of authentic information may presently don't be substantial.
However, the disturbances in AI will empower learning calculations, for example, support learning, interpretable learning like reasonable AI, and productive foundations, for example, edge processing and new sorts of chips.
2. Decay of the dashboard.
Information stories, (not dashboards) will turn into the most far and wide method of devouring investigation by 2025, and 75% of these accounts will be consequently produced utilizing increased examination strategies. Computer based intelligence and AI methods are advancing into business knowledge stages. In dashboards clients need to do a great deal of manual work to jump into additional experiences. Yet, these information stories give the bits of knowledge without requiring the client to play out their own examination.
3. Choice knowledge.
Over 33% of huge associations will have experts rehearsing choice insight including choice demonstrating by 2023. Gartner characterizes choice insight as a reasonable area that incorporates a wide scope of dynamic procedures. It incorporates applications like complex versatile frameworks. It incorporates a structure that unites conventional procedures like guidelines based methodologies along with cutting edge strategies like AI and AI. This empowers non-specialized clients to change choice rationale without including software engineers.
4. X examination.
The "X" here is a substitute for quite a few words that go before examination. Gartner said that AI for video, sound, vibration, text, feeling, and other substance investigation will trigger significant advancements and changes in 75% of Fortune 500 organizations by 2025. X represents the kind of examination, for example, video investigation or sound investigation. This will open new freedoms for investigation since this sort information has not been completely utilized by most associations. Be that as it may, the work to use it is developing. Sallam said that AI strategies and utilization of AI in the cloud are developing to grow selection and the effect of X examination. There are a large group of undiscovered use cases here, for example, picture and video investigation for store network streamlining, or video and sound examination for climate or for traffic the board.
5. Expanded information the executives:
metadata "a major trend dark." Organizations using dynamic metadata, AI, and information textures to progressively associate, improve, and mechanize information the board cycles will diminish time to information conveyance by 30% constantly 2023.
Computer based intelligence methods are being utilized to suggest the following best activity, or auto-revelation of metadata, or auto-checking of administration controls, among numerous others. This is empowered by an idea Gartner is calling information texture. Gartner characterizes information texture as something that utilizes consistent investigation over existing, discoverable, and inferenced metadata resources for help the plan, arrangement, and use of coordinated and reusable information objects, paying little heed to sending stage or structural methodology.
Read Here about, Linear Regression Vs Logistic Regression
6. Cloud is guaranteed.
Public cloud administrations will be fundamental for 90% of information and investigation advancement by 2022. Cloud-based AI will increment 5x somewhere in the range of 2019 and 2023, making AI one of the top responsibility classifications in the cloud. This pattern began a long time before the pandemic, yet COVID-19's effect on the venture has positively sped up it. Cloud sellers themselves are supporting information to knowledge to models inside their portfolios. From a cloud merchant point of view, the more the cloud suppliers get you to do information and investigation in their cloud, the more you will likewise figure in their cloud. On the undertaking side, utilizing public cloud administrations makes it feasible for associations to accomplish the work quicker. Cloud is the new stack, as indicated by Sallam.
7. Information and investigation universes impact.
Non-examination applications will advance to consolidate investigation throughout the following not many years, as indicated by Gartner. By 2023, 95% of Fortune 500 organizations will have met investigation administration into more extensive information and examination administration drives. Indeed, even sooner, by 2022, 40% of AI model turn of events and scoring will be done in items that don't have AI as their essential objective, Sallam said. Investigation and BI sellers are adding information the board abilities. Information the executives sellers are adding information prep. Hope to see more union sooner rather than later.
8. Information commercial centers and trades.
Gartner figures that 35% of enormous associations will be either merchants or purchasers of information through formal online information commercial centers by 2022. That is up from 25% in 2020, as per Sallam. This pattern is tied in with speeding up cloud, information science and AI, and AI, she said.
9. Commonsense blockchain (for information and investigation).
Gartner accepts that inside the information and investigation domain, blockchain will be utilized for upward explicit, business-driven drives like shrewd agreements. It will not be utilized to supplant existing information the executives advancements, as per Sallam. Blockchains are not naturally safer than elective information sources. Gartner gauges that by 2023, associations utilizing blockchain brilliant agreements will expand generally speaking information quality by half, yet diminish information accessibility by 30%, on the other hand making positive information and investigation ROI.
10. Connections structure the establishment of information and investigation esteem.
Chart advances will work with fast contextualization for dynamic in 30% of associations worldwide by 2023, as indicated by Gartner. Chart data sets and different innovations put the emphasis on connections between information focuses. Those connections are basic for most things we need to do with information and examination, Sallam said. We need to realize what are the drivers of this specific result? What thing did individuals purchase after they purchased an umbrella? What things do individuals purchase simultaneously? In any case, most connections are lost when utilizing customary capacity draws near. Combining social tables utilizes a ton of assets and debases execution. Diagram innovation saves these connections and increment the setting for AI and AI. They additionally improve the reasonableness of these advancements.
Do you know what is error loss? Find out Now: Mean Squared Logarithmic Error Loss
0 notes